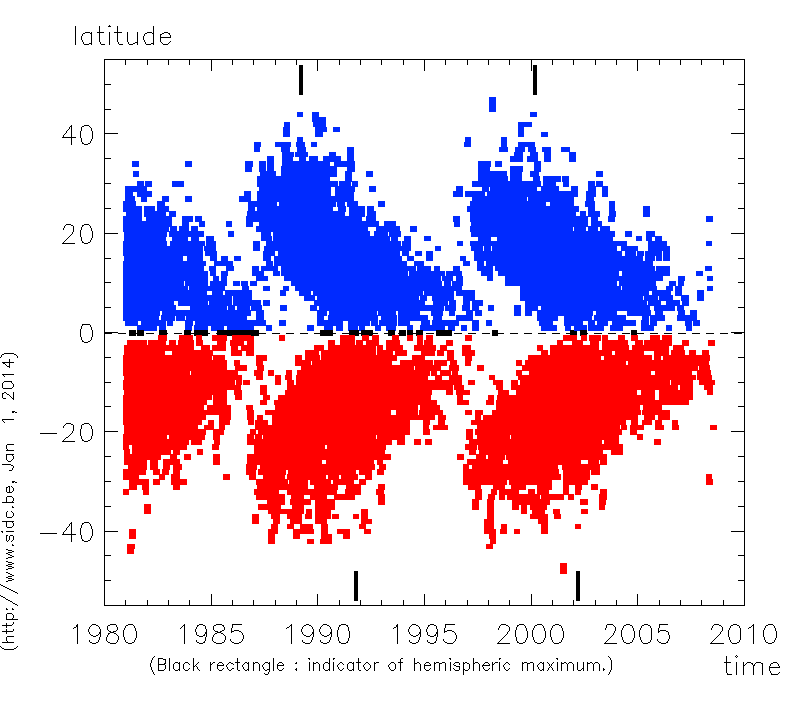
This graph shows the slow drift of the active regions on the disk from high to low latitudes during the solar cycle. The two vertical strokes indicate the respective positions of the maximum of the north and south components of the smoothed (over 1 year) sunspot number. The sunspot group positions are taken from the daily sunspot drawings made at Specola Solare Ticinese, Locarno, Swiss.
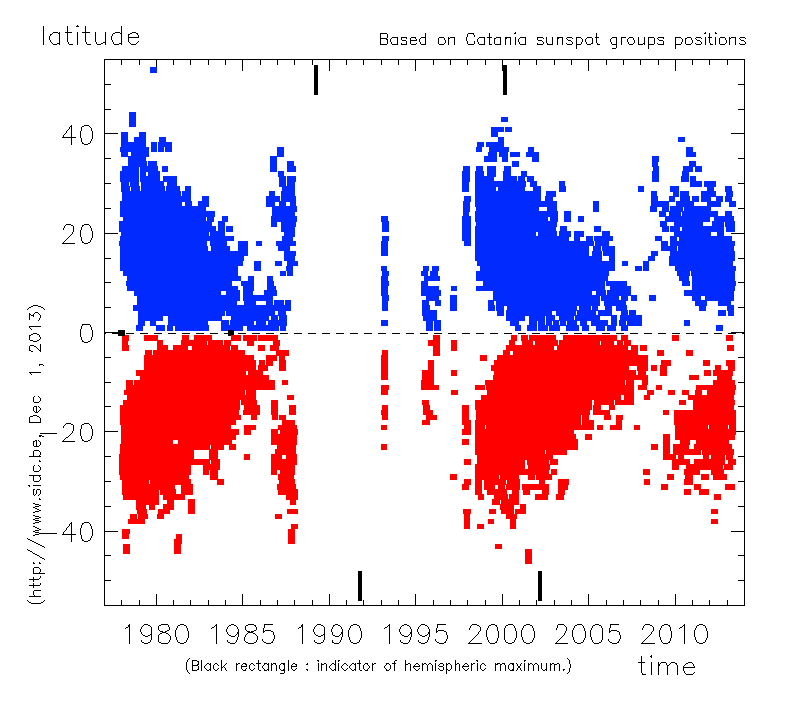
A similar graph is build up with data from the Catania Astrophysical Observatory, Italy. The figure ranges from 1978 up till now and is automatically updated on a monthly basis. There some missing blocks: from these periods, we don't have the data. The vertical stroke indicates the maximum of the southern hemisphere.