
A brief history
The Royal Observatory of Belgium (ROB) has played an essential role in the study of the Sunspot Number. Already since the mid 19th century, sunspots were observed at ROB. In 1908, Mgr. Eugène Spée (1843-1924), a Jesuit priest, started to take pictures of the solar surface using a Grubb heliograph which was placed in the tower of the solar dome.
From 1939, ROB started to send sunspot drawings and its sunspot counts to the World Data Center for the Sunspot Number located at the Zürich Observatory in Switzerland. This was done for over 40 years, until in 1981, the World Data Center was transferred from Zürich to the ROB in Belgium. The World Data Center at the ROB is called ‘SILSO’, which stands for Sunspot Index and Long-term Solar Observations (http://sidc.be/silso/). SILSO is THE World Data Centre responsible for collecting observations and counts of sunspots from an international and worldwide network of observing stations and for producing the International Sunspot Number.
The procedure to calculate the International Sunspot Number was defined in the 1850s and depends on the choice of a single reference ‘pilot station’ to which other observing stations are compared. So, the International Sunspot Number is sensitive to any problem that could arise with that station. The performance of a particular station in comparison with the pilot station is checked, but only once a year. Because of the possible errors, the results of these controls are not shared with the observers, nor with the scientific community. Even worse, the full content of the SILSO database is not available to the scientific community, nor to interested people.
Back to the solar dome. More than 23000 sunspot drawings which were acquired since March 1940 are part of the USET collection. USET stands for Uccle Solar Equatorial Table (http://sidc.oma.be/uset/) and refers to the table where the whole ‘fleet’ of solar telescopes are placed on. It is literally a table that can follow the Sun on its daily trip from East to West, from close to the horizon in winter to high above the horizon in summer. The USET sunspot drawing collection is the longest series of observations of the Sun which is still active. The drawings are made on paper and are then scanned to create a digital copy. But many digitised drawings lack additional info about for example the observing conditions. Because of this, a modern quality control is not possible. For this reason, the USET drawing collection has not been made accessible for the scientific community nor used in any scientific publication.
VAL-U-SUN wants to change this. The USET and SILSO treasure should be accessible to all solar researchers in order to get the maximum amount of science out of it.
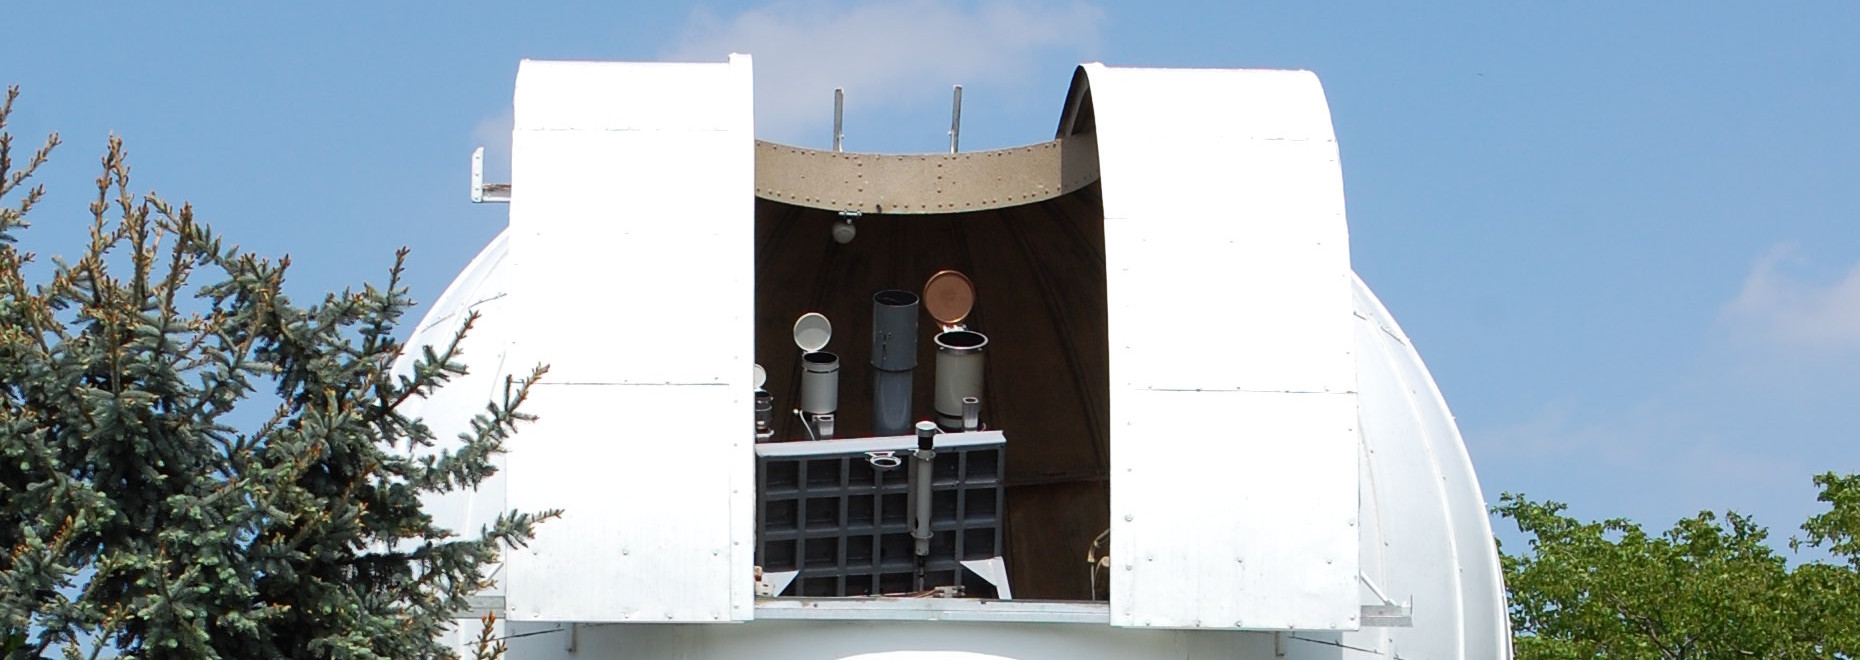 The building and dome of the Uccle Solar Equatorial Table (USET).
YOU are the key to check the scientific validity of the sunspot counts and unlock these treasures
The international science community wants a stable solar activity index, a reasonable request. This is why the techniques used to make sunspot drawings are deliberately kept unchanged, despite advances in observing techniques and the use of digital cameras. However, historical discrepancies in counting have slipped in and introduced an observers bias. Additionally, the strong correlation between the International Sunspot Number and the solar radio flux at 10.7 cm appeared to break down after the solar minimum of 1996. The correlation between these two indices was taken almost as an absolute truth and then this happens. On top of this, the ratio of the number of spots to the number of sunspot groups has decreased from its nominal value of 10.
Many problems and it still needs to be checked what the impact of these issues is on the International Sunspot Number. VAL-U-SUN wants to check the “quality” of each observer in the SILSO network, how the counting changed in the course of the years and if the shifts in the International Sunspot Number have a physical reason or not. YOU can help us to solve these scientific puzzles and prepare this historical series of data to go live!