photosphere image

The Sun is a ball of gas that is interlaced by magnetic fields which arise in its interior. Gigantic magnetic loops break through the solar surface and reach out towards the high solar atmosphere or corona. When strong enough, the magnetic bundles leave a dark footprint on the surface of the Sun, the photosphere. Such a footprint is called a sunspot and is literally seen as a dark spot. Usually, sunspots come in pairs or larger groups: a magnetic loop has two or more footpoints forming a group of sunspots.

These magnetic bundles hold loads of solar energy. At some point in time, the magnetic loop becomes unstable and is not able to keep its energy. This energy can be released in the form of a light flash. This is called a solar flare and is a space weather event. It is the magnetic solar machinery that makes 'space weather'. To understand space weather, we need to understand the behaviour of its driver, the magnetic field. And this brings us to sunspots which are spots of intense magnetic field.

The Sun seen in EUV gives a spectacular view: magnetic arcades move and sweep around, never sitting still. When too much magnetic energy is built up, the magnetic arcade can release a solar flare. The arcade restructures itself again into a more stable configuration. But how long before the next explosion?

The more complex the sunspots of a group, the higher the chances for a solar flare. Further, the higher the number of sunspots, the higher the chances for a solar flare. The number of sunspots seem to be a very good measure for the probability of solar explosions or solar activity.


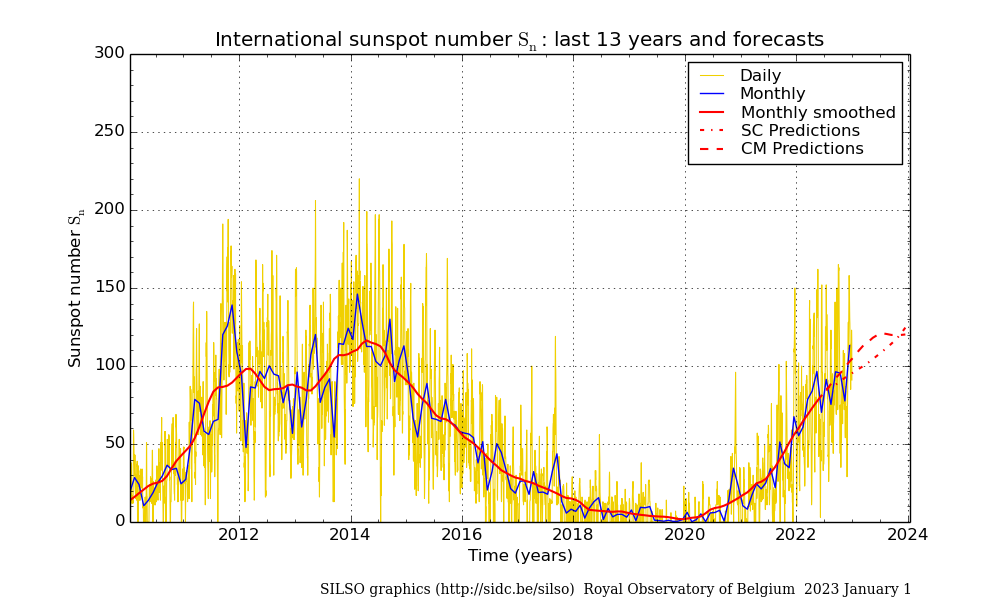
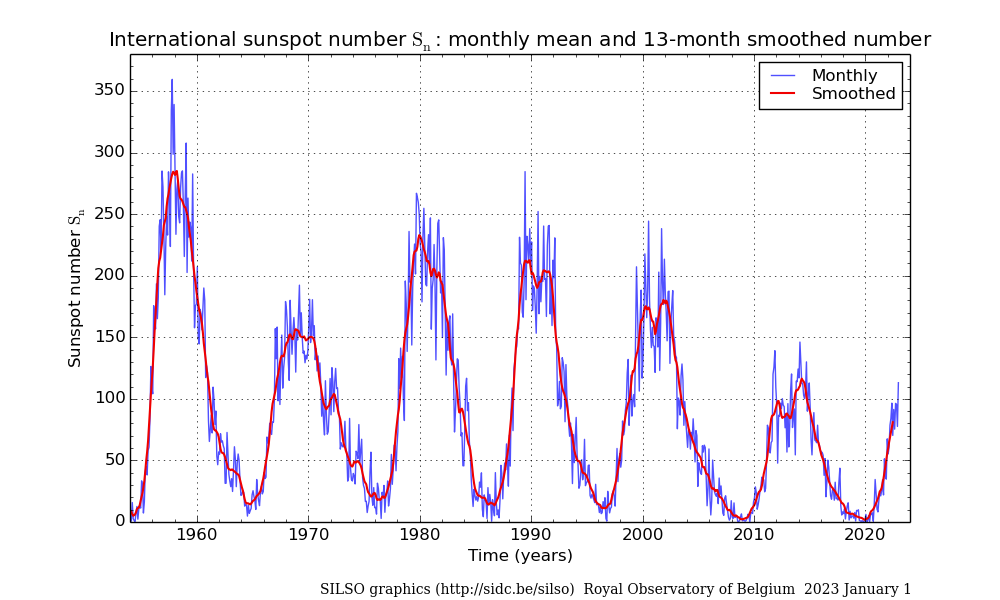
A solar activity proxy based on observed sunspots was 'invented': the sum of the total number of sunspots plus 10 times the total number of sunspot groups. This number is called the Wolf sunspot number. The sunspot numbers counted by different observers on a particular day can be combined with a statistical method to produce the daily International Sunspot Number (ISN), which gives an idea of how active the Sun is on that day. This daily number can vary dramatically but the ISN tends to vary according to an 11 year cycle. If we plot the ISN over an even longer period, it gives us an idea of the overall solar activity or space climate.

The SILSO World Data Centre is responsible for collecting observations and counts of sunspots from more than 80 observing stations worldwide and for producing the International Sunspot Number.