Regular solar observers have noticed that since mid-2016, the Sun has occasionally been devoid of sunspots. These spotless disks have become a familiar feature as the solar cycle is transiting through its minimum, which has taken place in December 2019 (see http://sidc.be/silso/node/167/#NewSolarActivity for more information). The number of spotless days can vary significantly from one solar cycle transit to another. For example, during the previous minimum (around 2008), no less than 817 spotless days were recorded, whereas the minimum period leading into solar cycle 23 (around 1996) counted only 309 such blemishless days. As the new solar cycle 25 has started, several consecutive days and even weeks without sunspots will become less frequent. In order to have an idea on the total number of spotless days during this minimum transit, and how these numbers compare to past solar cycles, the SILSO folks created a “Spotless Days page” back in 2016. This page contains graphs and tables on the accumulated number of spotless days, stretches of spotless days, and comparisons to other solar cycles – all supplemented with a word of explanation.
The previous minimum surprised scientists and solar observers by being the deepest in nearly 90 years, and also this minimum is -once again- a very deep one. This “Spotless Days page” will continue to provide you with a front-row seat on the current status of the solar cycle minimum and the number of spotless days. Enjoy!
Please note that the number and stretches of spotless days may differ from those of other sources (e.g. NOAA,…). The reason for this is simply because we (SILSO) are using a different network than e.g. NOAA (their Solar Region Summaries (SRS) are at https://www.swpc.noaa.gov/products/solar-region-summary). Here at SILSO, we use our own network (mostly European-based). The possible hours of observation are different from station to station and thus from one network to another, including the ones NOAA uses. The differences that are observed in the spotless days streaks are linked to small sunspots (not easy to see when they are there) with a short lifetime (not observed the whole day) that were observed by our network and not noticed by its NOAA counterpart.
So, the key point is that the duration of spotless time intervals is based on small-number statistics, as any rare single short-lived tiny spot can break a spotless interval. In that case, one can expect large differences between independent time series, but those differences should not be considered as statistically meaningful to characterize the solar cycle. Finding the longest spotless interval is more like a curio. A more meaningful index is the total number of spotless days over an entire cycle minimum, however those spotless days are grouped in contiguous intervals.
We’d like to emphasize there's no "wrong" here. Only, when comparing sunspot numbers or spotless days statistics, this should be done within the time series from the respective networks.
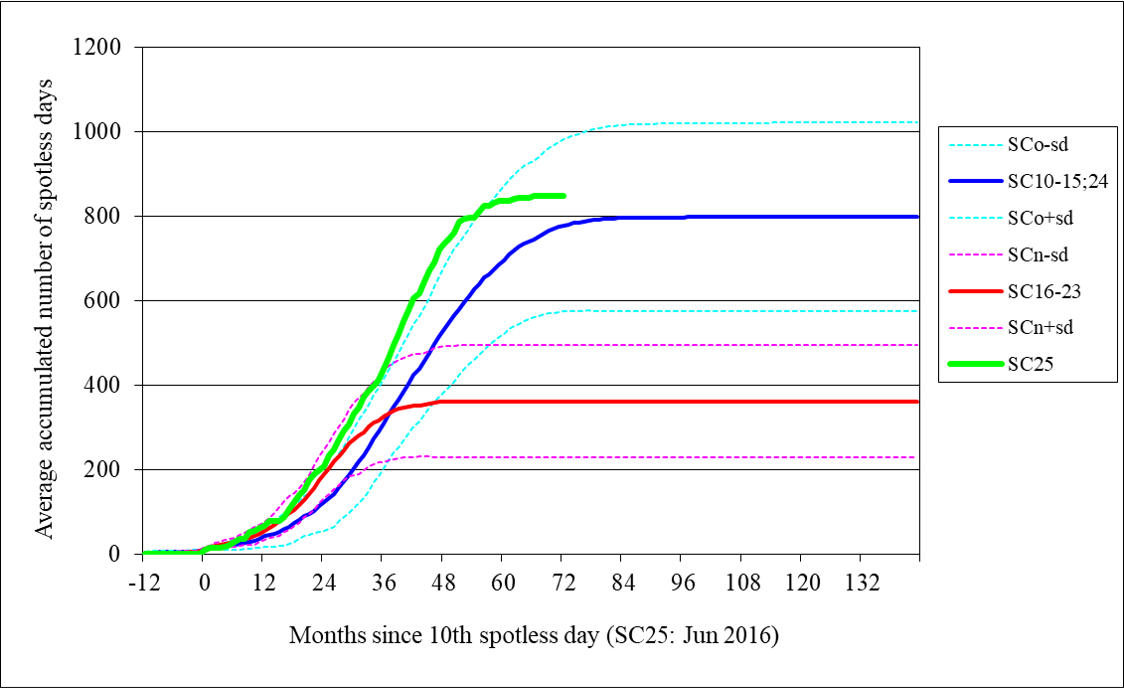
The thick green line in the graph above shows the accumulated (total number of) spotless days so far during the transit from solar cycle 24 to 25. The thick blue and red line show the same parameter, but respectively for the average of solar cycles 10 to 15 and 24 (SCo), and of solar cycles 16 to 23 (SCn).
This distinction is made because the first group has a long delay (about 4 years) and many spotless days (almost 800 on the average), whereas the other group has barely 2 years between the month with the 10th spotless day and the cycle minimum, and not even half of the total number of spotless day of the first group (less than 400 days!).
It must be noted that the extremes between the cycles in a group can be even more significant: For example, in the SCo-group, the final number of spotless days has varied between 406 and 1028!
The thin dashed lines show the respective standard deviations (+sd and -sd). To avoid overloading the graph, purple and pink vertical lines representing the average timing of the cycle minimum (and standard deviations) compared to the month with the 10th spotless day, and this for the respective cycle groups (SCo min, SCn min), are not shown. Solar cycle minimum has taken place in December 2019 (see http://sidc.be/silso/node/167/#NewSolarActivity as well as http://sidc.oma.be/silso/node/166 for more information). This timing is well within the uncertainty margin of the prediction based on the SCo group (May 2020 ± 10 months). Following the emergence of several sunspot groups during the last few months of 2020, the spotless days evolution (bold green line) has halted its steep increase and has leveled off slightly above the final average of the SCo cycles (blue curve). It follows a pattern nearly identical to that of the previous solar cycle transition (see chart underneath). As the new solar cycle 25 has started its ascending phase, it is expected that the increase will further flatten out during the coming months, occasional small stretches of consecutive spotless days not excluded. The current solar cycle transition counts already more spotless days than the previous one (currently at 848 vs 817 during the SC23-24 transition)! 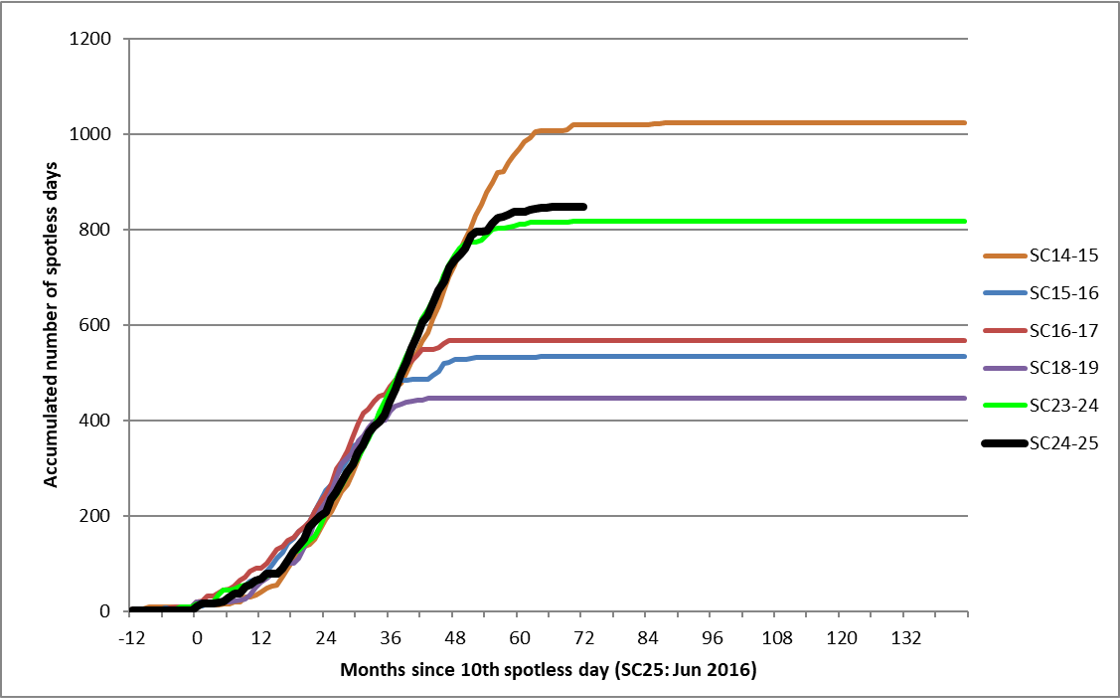
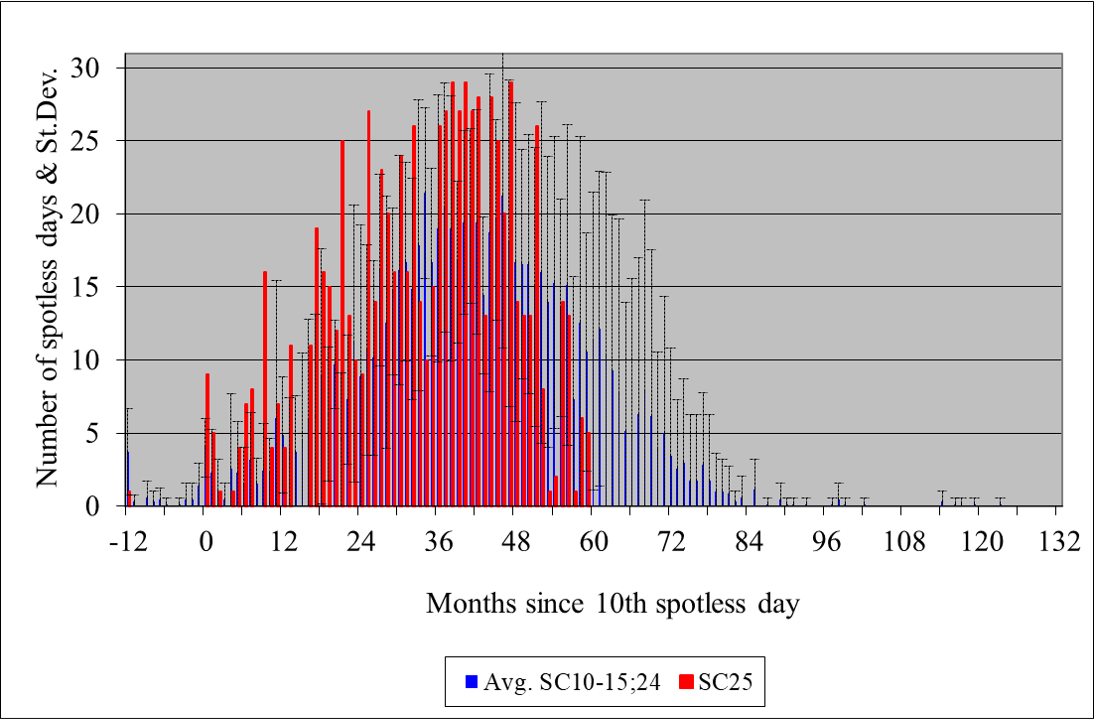
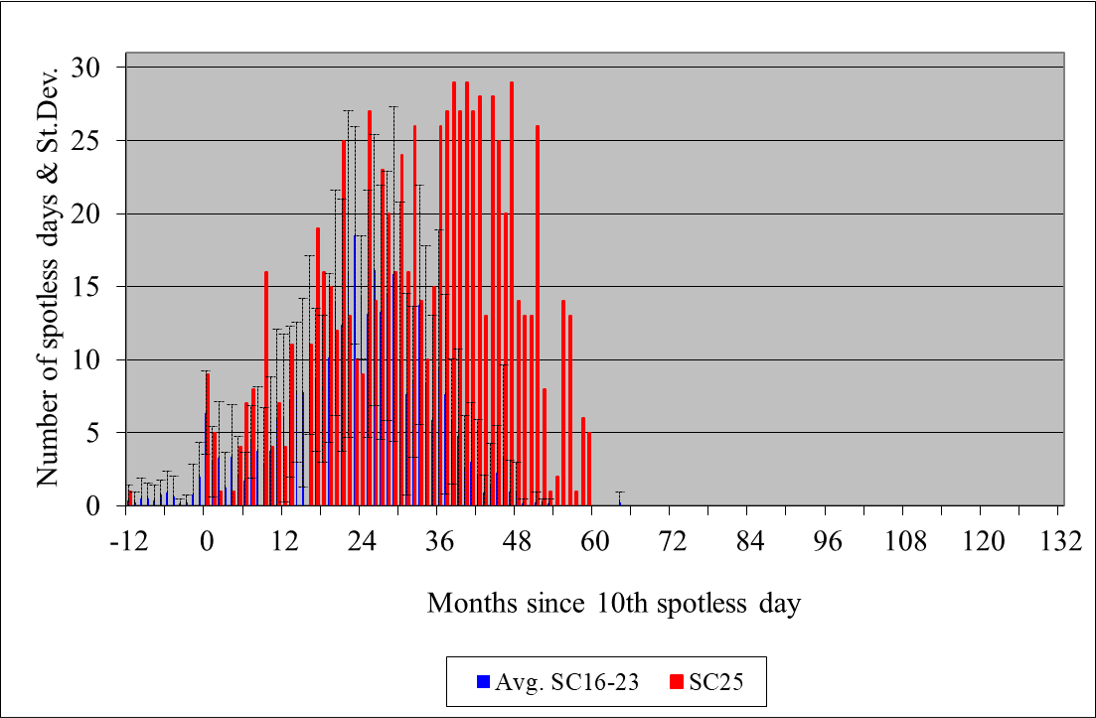
The two graphs above show the monthly number of spotless days during this cycle transit (red) compared to respectively the average number during SC10 to 15 and 24 (SCo; top), and during SC16 to 23 (SCn; bottom). The baseline is again the month with the 10th spotless day after solar cycle maximum. Any spotless days happening more than 12 months before this baseline (month "0") have been accumulated in month "-12". The "T"'s represent the standard deviations. There's a big difference between the two groups, with the SCn-group peaking early around 2 years with an average of about 10-15 spotless days per month, whereas the SCo-group peaks only after 4 years with an average of 15-20 spotless days per month. The monthly numbers of spotless days from the SC24-25 transition clearly fit much better the evolution of the SCo group than that of the SCn group.
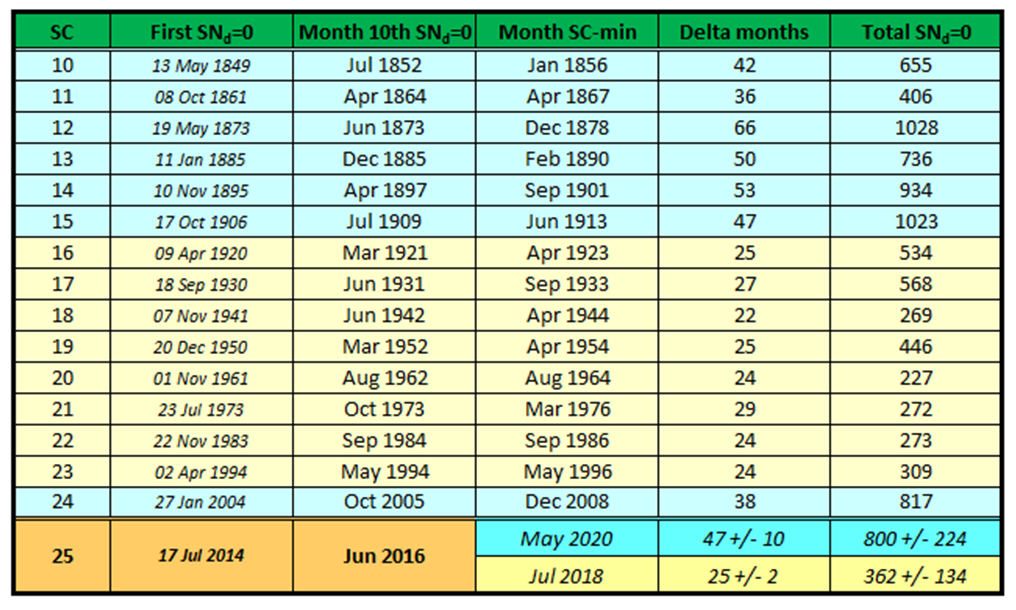
The table above gives for each new solar cycle the date of the first spotless day (after solar maximum...), the month with the 10th spotless day, the month in which the (Meeus smoothed) solar cycle minimum took place, the delay in months between those last 2 timings, and the total number of spotless days that occurred during the cycle transition.
As can be seen, there is a big difference between the two solar cycle groups.
The first group (SCo; light blue) has a rather long delay (47 months) and many spotless days (about 800 on the average), whereas the other group (SCn; yellowish) has only 25 months between the month with the 10th spotless day and cycle minimum.
Notice also the very narrow band in timings (only 4 months!) for the SCn-group. The SCn-group contains on the average not even half of the total number of spotless day of the SCo-group (less than 400 days vs. 800!).
Note there's no obvious correlation between the total number of spotless days and the subsequent solar cycle maximum (r2=0.35). For example, a total of 200 to 400 spotless days can result in a cycle maximum sunspot number between 150 and 250. Not very accurate indeed! In view of the ongoing revision of the sunspot number, it is possible there may be some changes in the number of spotless days for SC10-11.

The table above shows all periods with 30 or more consecutive spotless days. The period from 14 November 2019 till 23 December 2019 is one of the longer ones since the beginning of daily solar observations in 1849, making it all the way in the Top 10. A slightly longer period in recent history occurred during the SC22-SC23 transition, from 13 September 1996 till 24 October 1996, when the Sun was spotless for 42 consecutive days. One of the longest spotless periods (since 1818) is probably from 24 October 1822 till 12 March 1823 (140 days!), but unfortunately, the series are broken on 29 December 1822 (no observation available for that day).
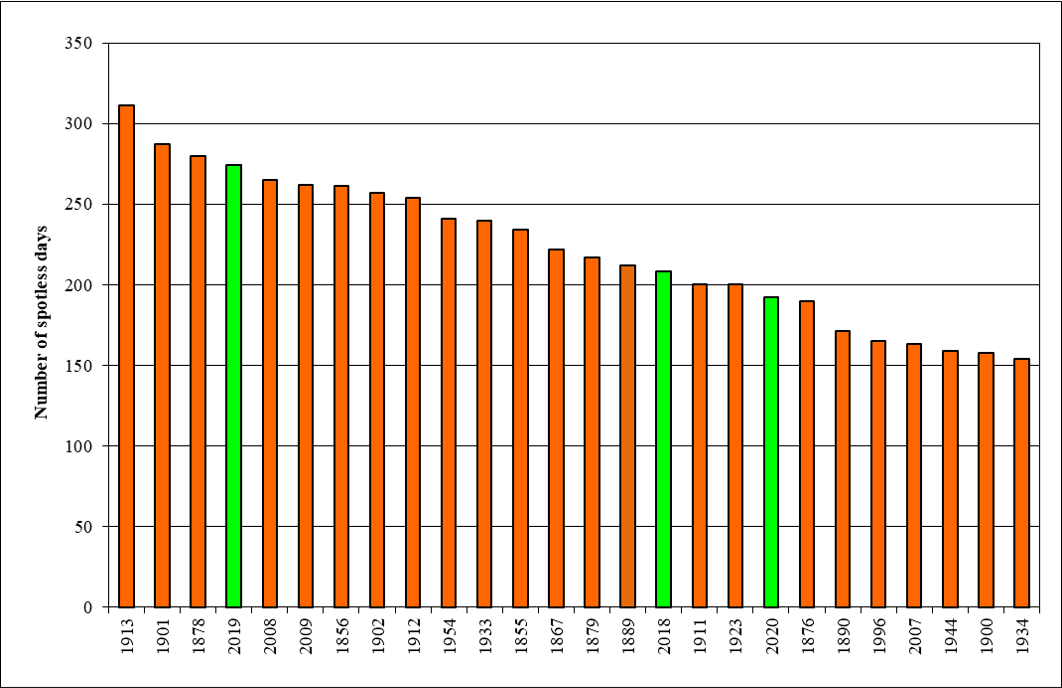
Since 1849, there have been 116 years (including 2021) with at least 1 spotless day (2020: 192 ; 2021: 50). The chart above shows the 25 years with the highest number of spotless days. The years of the current solar cycle transit are marked in green. With 274 days, 2019 has ranked itself on the 4th place in this list. This number dwarfs that of 2018 (208), and is even stronger than the numbers recorded during the years of the previous solar cycle minimum, i.e. 2008 (265 days) and 2009 (262). Only 3 years have produced more spotless days than 2019: 1878, 1901, and the year 1913 which is recordholder with a staggering 311 days. A table with the number of spotless days per year can be found here: Spotless days per year
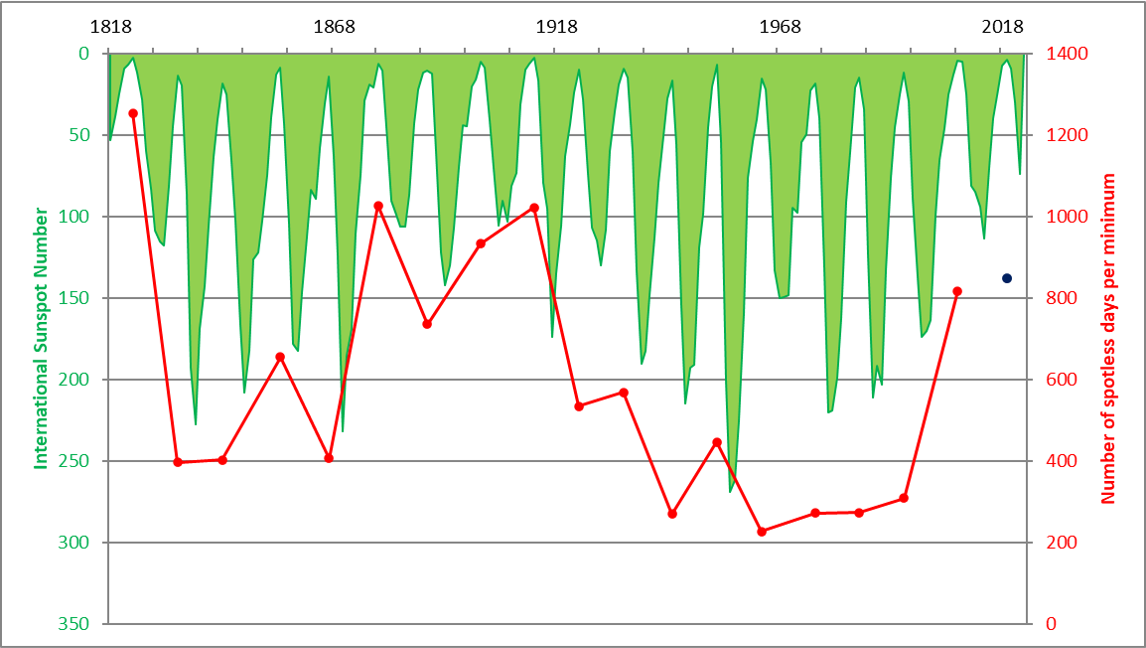
The graph above shows the evolution of the total number of spotless days per cycle minimum transition and the yearly international sunspot number (Sn) since 1818. Note the values for Sn are in reverse order. The number of spotless days has been set in the year of the cycle minimum. For example, there were 817 spotless days during the SC23-24 transition, and this data point has been set in 2008, the year of the solar cycle minimum. There are some missing data for the period 1818-1849, and the data for SC10-11 are under revision, but all in all this graph conveys pretty well that -in general- a low amplitude cycle is preceded by a solar cycle transition with a high number of spotless days, and vice versa. Nonetheless, there are some notable exceptions, such as SC16 and SC20. The blue dot to the right represents the number of spotless days (848) for the current cycle transition. The current projection of a high total number of spotless days makes it more likely that SC25 will be a low amplitude cycle.
Last update: 5 July 2022
Next update: at the start of the next solar cycle transition (SC25-26)