Belgian Science Programs And Archive
Abstract:
Through their participation in the Extreme-ultraviolet Imaging Telescope
experiment (EIT) of the SOHO mission, the Solar Physics Department of
the Royal Observatory of Belgium (ROB) and the Centre Spatial de Ličge
(CSL) contributed to the instrument development,
calibration and in-flight control. With EIT, the ROB is conducting
scientific investigations of the local and global physics of the solar
corona, and has initiated multi-instrument observing campaigns for that
purpose. Based on a complete archive of all EIT observations assembled
and maintained in Uccle, the ROB has now started an ambitious survey of
the upper solar atmosphere and its evolution, starting at the beginning
of solar cycle 23 and extending beyond the forthcoming solar activity maximum.
Introduction
The coronal instruments on the Solar and Heliospheric Observatory (SOHO), a joint NASA/ESA mission, were designed to bring new insight concerning the physical mechanisms that cause the extreme heating of the solar corona to million-degree temperatures and the acceleration of the solar wind. This continuously expanding outer-atmosphere of the Sun, carrying streams of charged particles and magnetic fields, is one of the main sources of interaction between solar activity and the Earth environment. Although earlier missions, like Skylab, XMM and YOHKOH led to a better understanding of the largest energy releases in the corona, the solar flares, a new generation of more sensitive instruments was needed to explore the so-called "quiet Sun" regions. The latter account for the largest volume in the hot and thin corona.
Among SOHO's coronal experiments, the Extreme-ultraviolet Imaging Telescope (EIT) uses innovative normal-incidence mirrors to provide global high-resolution views of the on-disk corona. This telescope is able to image the faint emission of the quiet corona. Since the start of the current solar activity cycle in 1996, it ensured a continuous monitoring the solar atmosphere, except for a 3-month interruption from July to September 1998, when the contact with the SOHO spacecraft was temporarily lost. With the VIRGO radiometric package, EIT represents the main Belgian contribution to the successful SOHO program.
EIT experiment
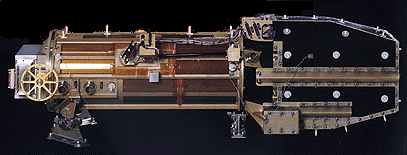
The EIT optical design [1], [2] is based on normal incidence mirrors in a Ritchey-Chrétien configuration (Fig. 1), which produces a better image quality over a wide field of view than classical grazing incidence optics (Woltjer type telescopes). Multilayer-coatings on the primary and secondary mirrors allow them to reflect up to 20% of the extreme-ultraviolet (EUV) light within a fairly narrow wavelength range, thus also acting as bandpass filters. The four quadrants of the same mirror have been coated with different multilayers. By adding a rotating mask in the entrance aperture, it is thus possible to acquire co-aligned images of the corona in four different emission lines, produced by ions formed at different temperatures, from 8 10^5 K (transition region, hereafter "TR") to 2 10^6 K (corona).
| Table 1: EIT observing wavelengths | |||||||||||||||||||||||||
|
 |
|
| Figure 1: A view of the EIT instrument |
The Solar Physics Department of the ROB and the CSL are involved in the EIT experiment on SOHO since the early development stages. In the framework of the Belgian participation as EIT co-Investigators, CSL managed the instrument development and testing prior to launch, and monitored the in-flight response and detector aging in space. While the ROB participated in the ground-based instrument calibration and is taking care of the determination of flat-field corrections in the course of the mission, its primary goal was to develop several coronal observing programs and campaigns. As a support for those activities, Belgian scientists took part in the instrument operations, in two-week or one-month shifts, at the SOHO Experiment Operations Facilities at the NASA Goddard Space Flight Center almost every year since 1996.
| Table 2: Specifications of the EIT telescope and camera |
||||||||||||||||||||||||||
|
Eit calibration and
in-flight aging correction
Basic calibration
The EIT instrument was calibrated before flight at the Orsay synchrotron. CSL and ROB participated to those photometric calibration campaigns. A reference CCD flat-field (Fig.2), that characterizes the sensitivity variations across the image sensor, was obtained at two wavelengths (195 and 284 Ĺ). Those pre-flight data are summarized and discussed in Dere et al.[3].
Another essential correction was needed to compensate a grid pattern produced by the aluminium filters placed just in front of the CCD to reject UV and visible light. Those filters are supported by an opaque grid that interferes with the optical beam, producing a strong shading pattern in all images. No pre-flight correction could be derived because it is practically impossible to produce a uniform EUV illumination over EIT's wide field of view. Therefore, once in flight, a method has been developed to numerically extract a reference grid pattern in each quadrant and for each filter from sequences of solar images selected from the early flight data (Fig. 3). Those corrective maps are now used in standard procedures to correct all the EIT images.
Response calibration
Since its first light in January 1996, the instrument throughput showed important changes that can be unambiguously distinguished from the solar variability. The quasi-permanent sun-pointing configuration and the very long cumulated exposure to the EUV solar flux are mainly responsible of the evolving damage on the most exposed pixels of the detector. The four EUV channels are affected by these sensitivity modifications, with different levels of degradation. Specific detection techniques were used to identify the nature of the damage. They showed that the degradation process is the combination of 2 physical effects:
- a global signal reduction over all the pixels, due to the continuous deposition of condensed materials on the cooled detector
- local burn-in effects on the most irradiated pixels, which are produced by electrical charging within the pixel structure due to the EUV photons.
The CCD detector is equipped with a decontamination heater, which is regularly used to bake out the condensed materials that are trapped by the cooled CCD. Those bakeout sequences provide significant improvements in all the EUV and in the visible-light responses. Both of the degradation effects are partly removed with the bakeout sequences.
The CALROC intercalibration
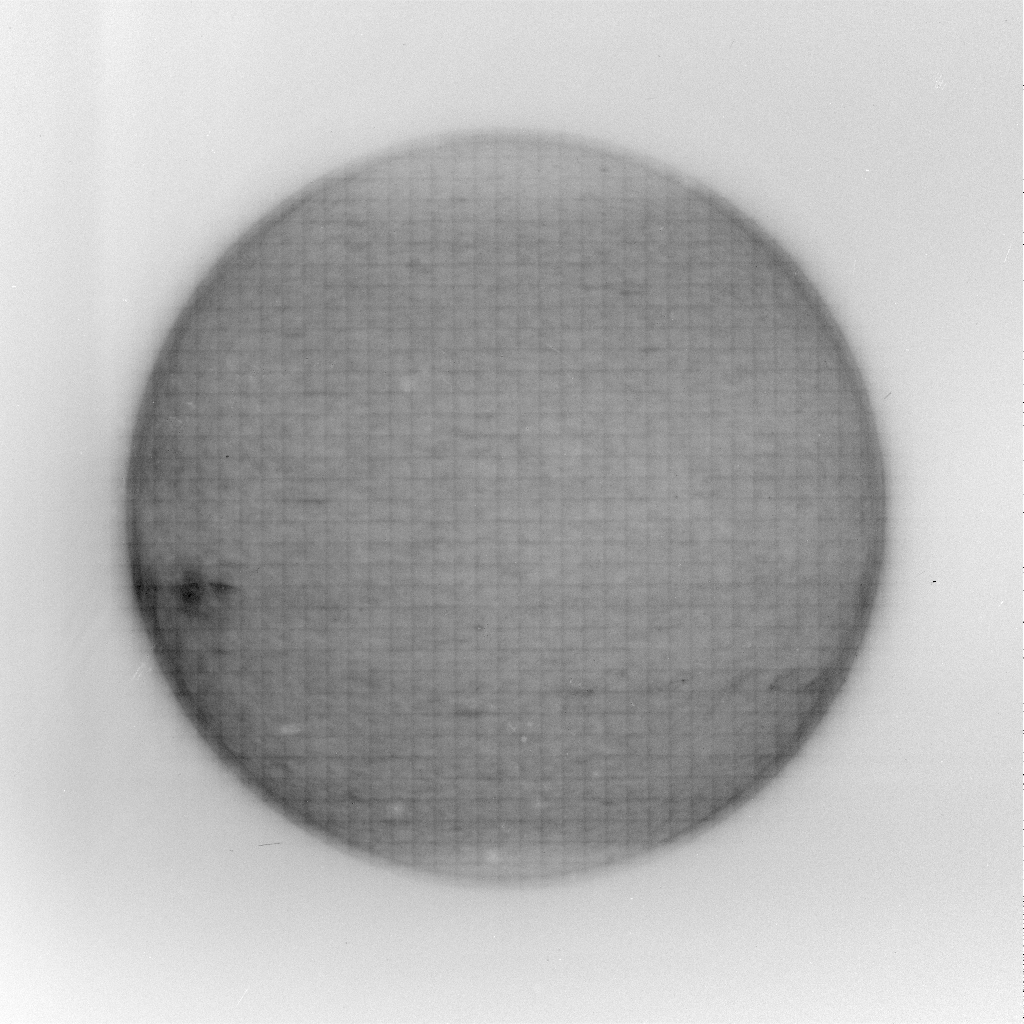
On-board calibration lamps (visible light) are regularly used to monitor the spatial distribution of the aging (Fig. 4). However, as the degradation is strongly wavelength dependent, the amplitudes in the visible do not match the true degradation factor in the EUV. Therefore, the EIT-CALROC program was set up to provide well-calibrated observations using the flight-spare EIT elements on a sounding rocket platform. Since the observed EUV response variations are a complex wavelength dependent combination of uniform and local effects in the EIT images, only a full-disk EUV imaging instrument is capable of providing an adequate absolute calibration.
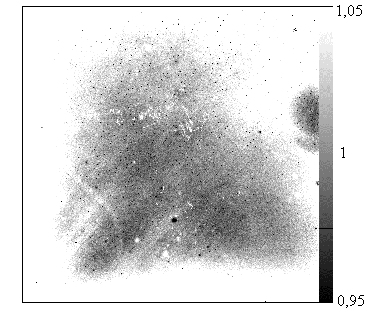
In a joint preparation involving CSL and ROB, spare optics, detectors and mechanisms were assembled and qualified as a second EIT instrument adapted to a rocket flight. A ground-based calibration of the photometric and spectral responses of the new instrument was completed before the successful launch on October 16, 1997 from the White Sands Missile Range (NM, USA). During a 5-minute observing sequence, at the apogee of the flight (altitude: 350 km) where the absorption of the residual atmosphere reaches a minimum, a complete set of images in all the channels was collected. The resulting EIT/CALROC ratio maps (Fig. 5) provided a first accurate EUV calibration of the EIT CCD sensor, after 22 months of in-situ operations. After this first launch, the payload was recovered in good condition, offering now the opportunity of a second flight.
New insights in the "quiet sun" minor activity
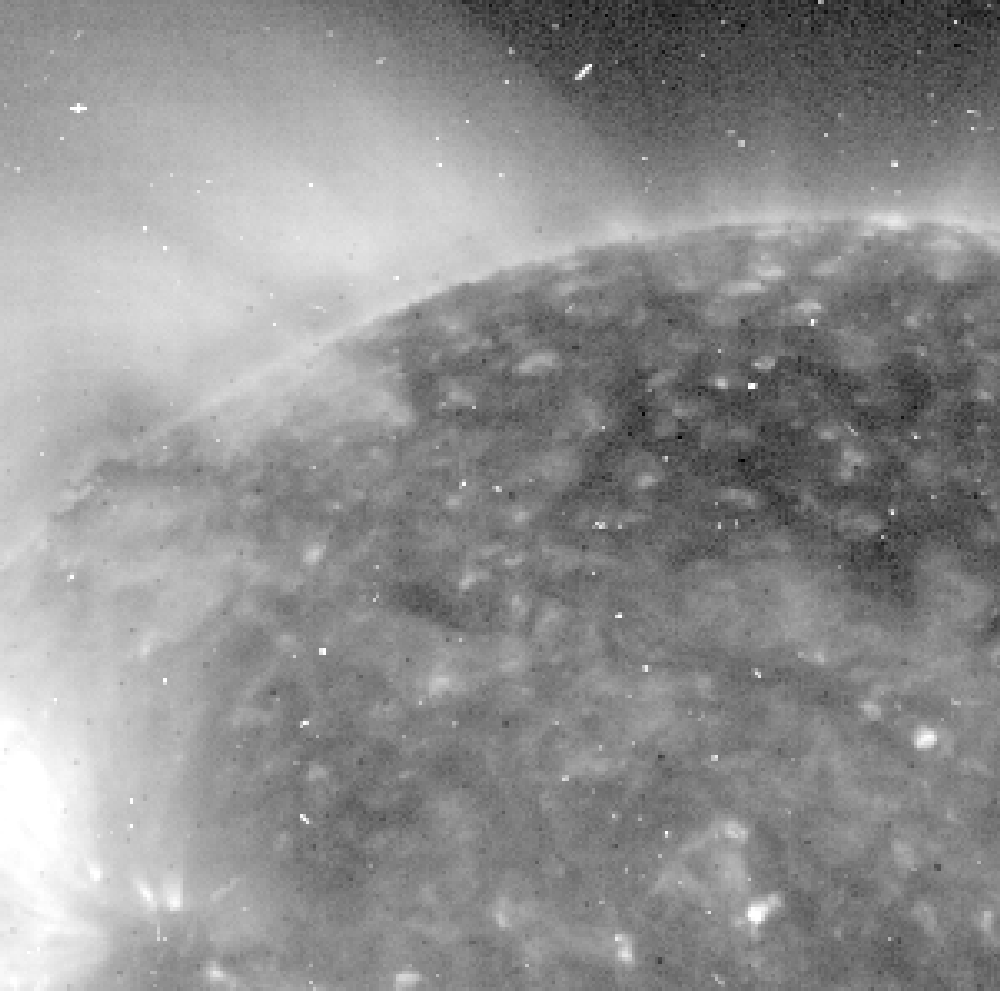
As the coronal emission lines detected by EIT correspond to the coolest temperatures found in the corona, the resulting images are well suited to observe minor activity in the low-lying "quiet" corona. Using EIT's high-cadence capability (up to 1 image /15s) and wide field of view, we have conducted a systematic study of the small-scale dynamics of the solar transition region and corona. In the intricate magnetic texture of dim loops induced by the convective motions present under the solar surface (Fig. 6), EIT can indeed capture large numbers of local and short-lived transient brightenings (TB) with durations between 30s and 30 min, which allowed us to study their statistical properties. So far, this research effort culminated with the SOHO Joint Observing Program (JOP) 80, which was led by the ROB scientists and used EIT as the primary instrument in its fastest imaging mode. This JOP, executed on May 13, 1998, involved a joint observing campaign combining several solar imagers and spectrometers in space (SXT, TRACE, MDI, CDS, SUMER) and on the ground (La Palma and Sac Peak).
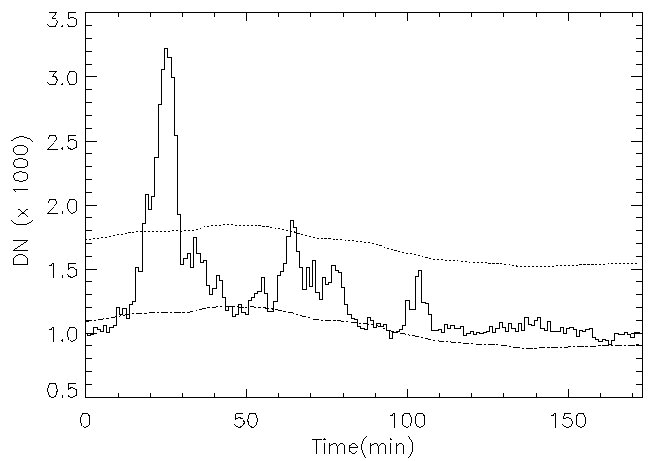
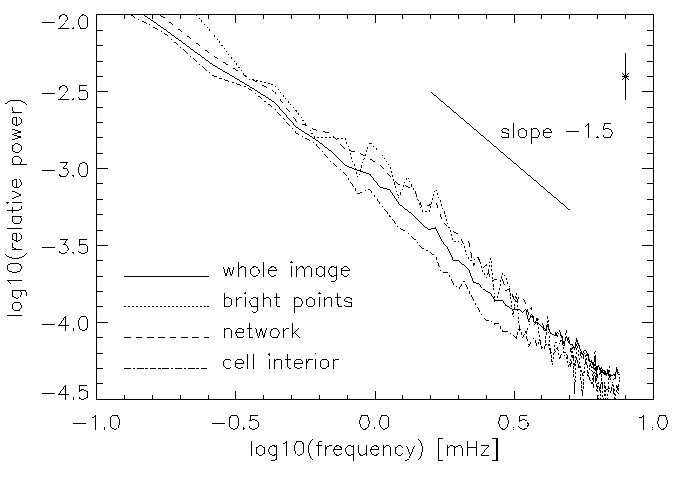
In the TR that forms the base of the corona, we found a TB rate of about 40 events/s over the whole solar surface. The spatial and temporal power spectra of those "blinkers" display a power-law distribution (Fig. 7 left) with an index of -1.5, suggesting a magnetohydrodynamical (MHD) turbulent energy cascade [4], where energy is injected at the largest scales and dissipated at scales smaller than the range accessible in our spectra. What was called the "quiet Sun" is thus actually made of turbulent plasma that continuously experiences sudden emission enhancements due to local heating events.
The amount of heating contributed by those minor but innumerable transients is one of the key issues to understand why the coronal plasma is heated and accelerated over its entire volume. Based on thousands of detected transients, we computed the histograms of the energy per event (Fig. 7 right). In the TR, we find a single power-law distribution with a spectral index of -1.9 +/- 0.1. This power-law index almost matches the critical value of -2, below which the essential part of the energy injected in the corona in fact comes from the numerous small events. The bulk of the coronal heating would thus find its source in the smallest but also most numerous flaring events. Furthermore, a comparison of the global properties of EIT brightenings (duration, energy, peak flux) with numerical models of nanoflares [5] provide indirect evidence that the coronal and the transition region brightenings detected by EIT belong to a wider and possibly unique population. This population would then span the whole energy range, extending from the largest flares down to the explosive events [6], i.e. over 9 orders of magnitude. All classes of transients would thus be the manifestation of the same physical process: magnetic reconnection driven by the random turbulent motions of the sub-photospheric convection.
|
||
| Figure 7: Power spectra averaged over different structures in the transition region (left). The observed power law is suggestive of fully developed MHD turbulence. Histogram of the energy output per brightening event (right). The steep slope of -1.9 might indicate that most of the coronal heating is contributed by the smallest events, assuming that their number continues to increase as their energy decreases, even below the current detection threshold. |
Small-scale variability in an active region (JOP80)
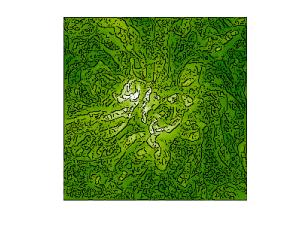
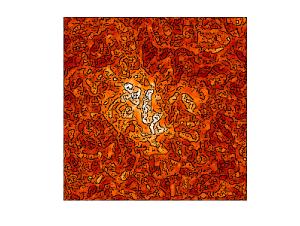
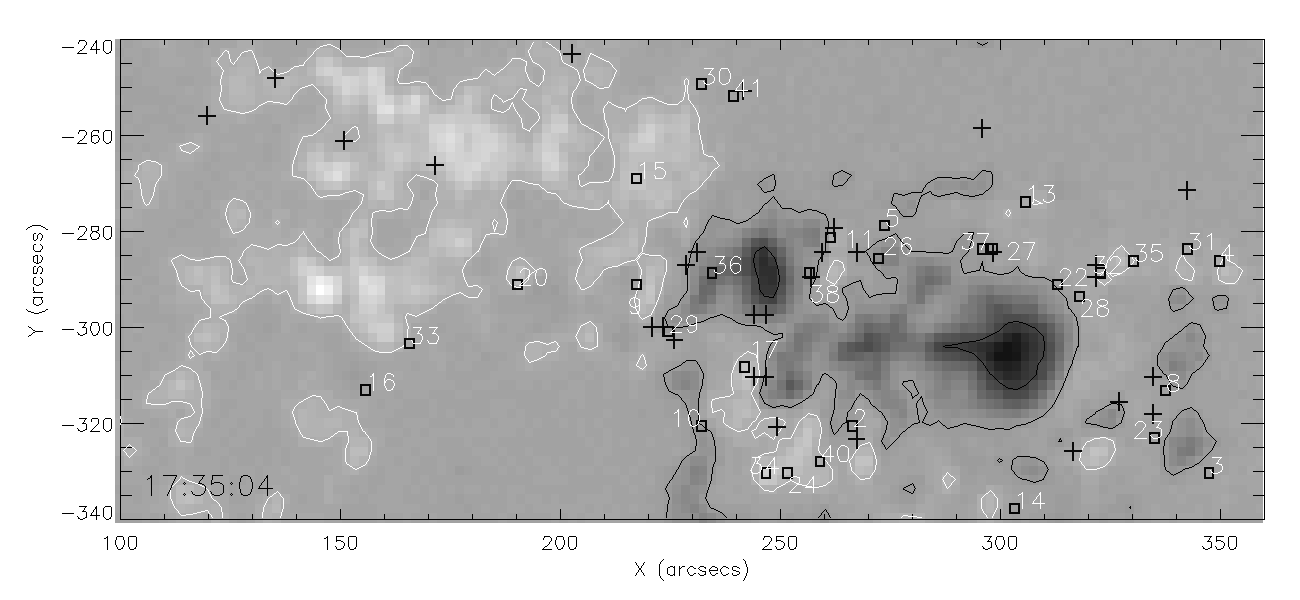
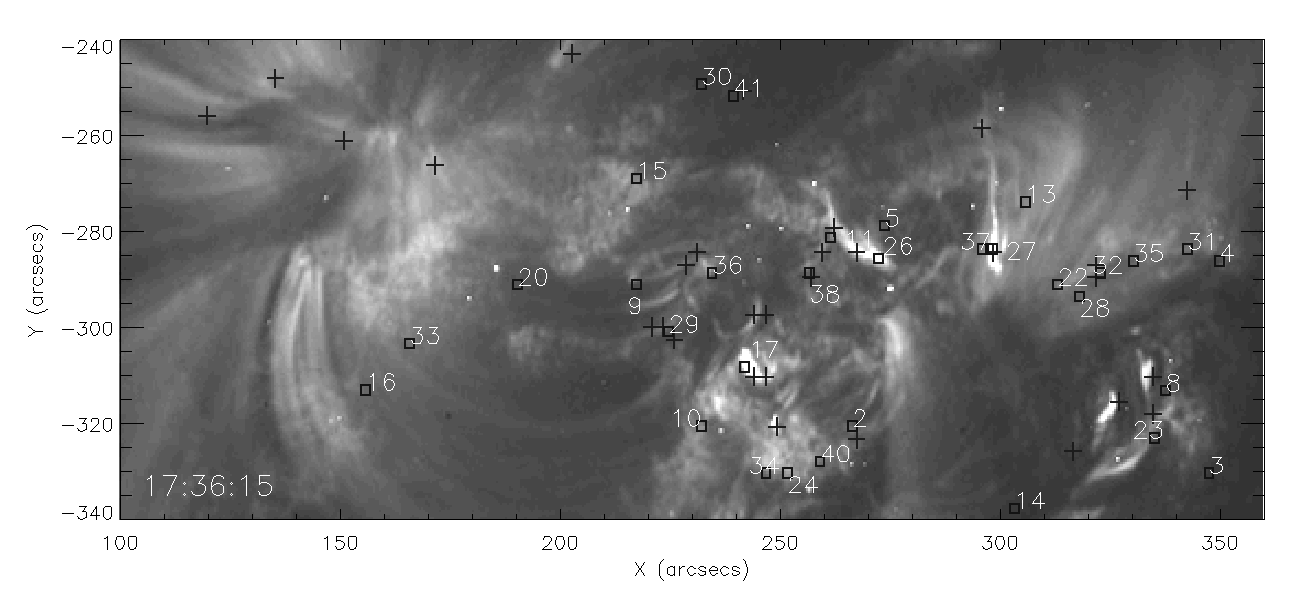
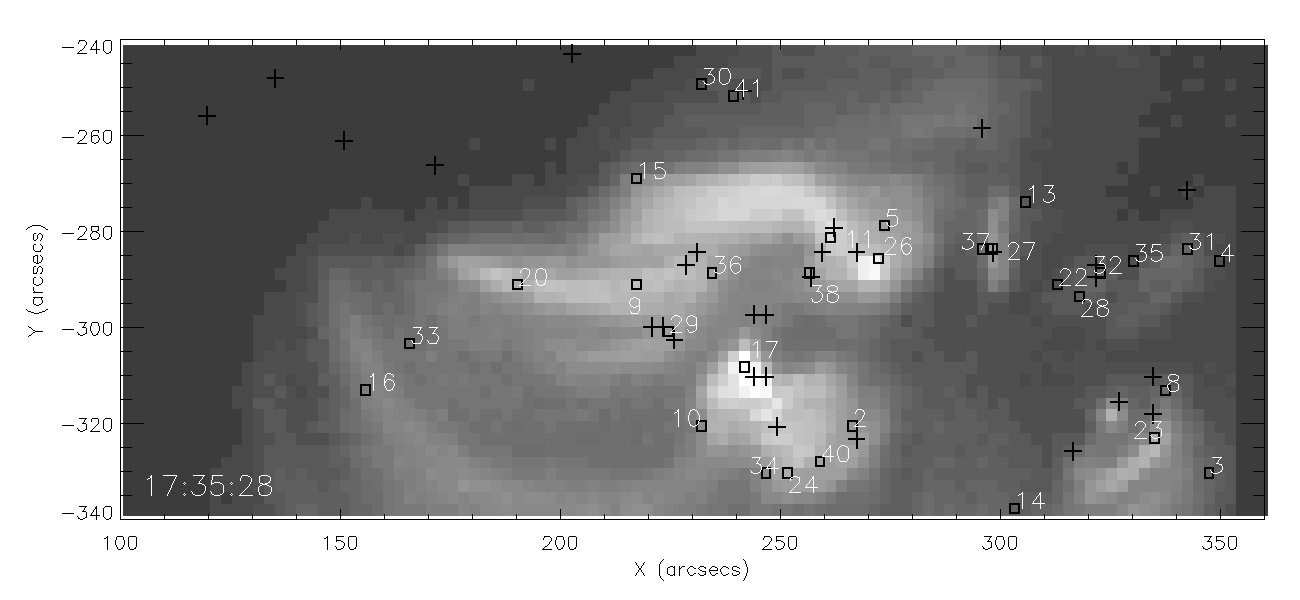
On May 13, 1998, the JOP80 campaign focused on a small active region (AR 8218). The resulting multi-instrument data set has proven to be most valuable for comparing signatures of microflares in active regions at different heights/temperatures in the corona. The spatial distribution of all TBs, plotted in Fig. 9, shows the strong correlation between the observed events and the neutral lines separating sunspots of opposite magnetic polarities. The detailed examination of individual events revealed several classes of evolutionary patterns. Some TBs could be identified as the cooler counterparts of the active region TBs first detected one decade ago in soft-X rays by SXT on YOHKOH [7].
However, the EIT sensitivity to cooler plasma reveals a 5 times larger population of small-size flare-like brightenings, which went so far undetected and are due to smaller energy releases (temperatures below 2 10^6 K). In many cases, motions are observed, as well as multiple correlated brightenings. Those evolutionary patterns can be interpreted as mass flows or as slow-mode MHD waves propagating along magnetic loops, which are the indirect consequences of the primary micro-flare events (Fig. 8). Our observations thus show that part of the energy injected by small-scale magnetic reconnections is actually released far from the flaring location.
Figure 8: Example of the time evolution (left to right) of a microflare detected in AR 8218. The top row shows soft X-ray images from SXT (temperature > 3 million K), while the bottom row shows EUV images from EIT (1.6 million K). The interaction of several magnetic loops and their reconnection can be seen clearly at the different temperatures.
Another kind of variability was discovered in large-scale closed magnetic loops that diverge from the active region and are connecting it with other distant active regions (up to 500000 km away). Quasi-periodic TBs at the footpoint trigger propagating disturbances that travel outwards along the loop at a speed of about 100km/s, as is illustrated by a sample time-distance diagram (Fig. 10), where they show as successive bright and dark ridges. As the propagation speed agrees well with the theoretical sound speed in such structures [8], they can be identified as slow magneto-acoustic waves. The strong similarity of this phenomenon with travelling disturbances, observed by DeForest & Gurman [9] along polar plumes inside open field regions known as coronal holes, demonstrates that these extended magnetic arcades can behave like quasi-open magnetic field lines. Therefore, such elusive MHD waves might well occur in many if not all coronal structures.
At this stage of the JOP80 analysis, all our results illustrate effectively why a multi-wavelength approach is indeed needed to fully understand by which processes micro/nanoflaring events contribute to the coronal heating. As the coronal magnetic structures experiencing TBs change completely over the solar activity cycle, the ROB team has now proposed to run JOP80-like high-cadence observing campaigns on a regular basis until the end of the SOHO mission.
|
|
|
Figure 9: Spatial distribution of minor transient brightenings in AR8218
(crosses: EUV events, squares: soft X-ray events)
superimposed on three simultaneous images:
|

|
| Figure 10: Time-distance diagram showing quasi-periodic disturbances propagating along large-scale magnetic loops rooted at the periphery of an active region. The position along a single loop is given by the vertical axis, while time flows horizontally to the right. |
The Belgian EIT archive and the long-term evolution study
|
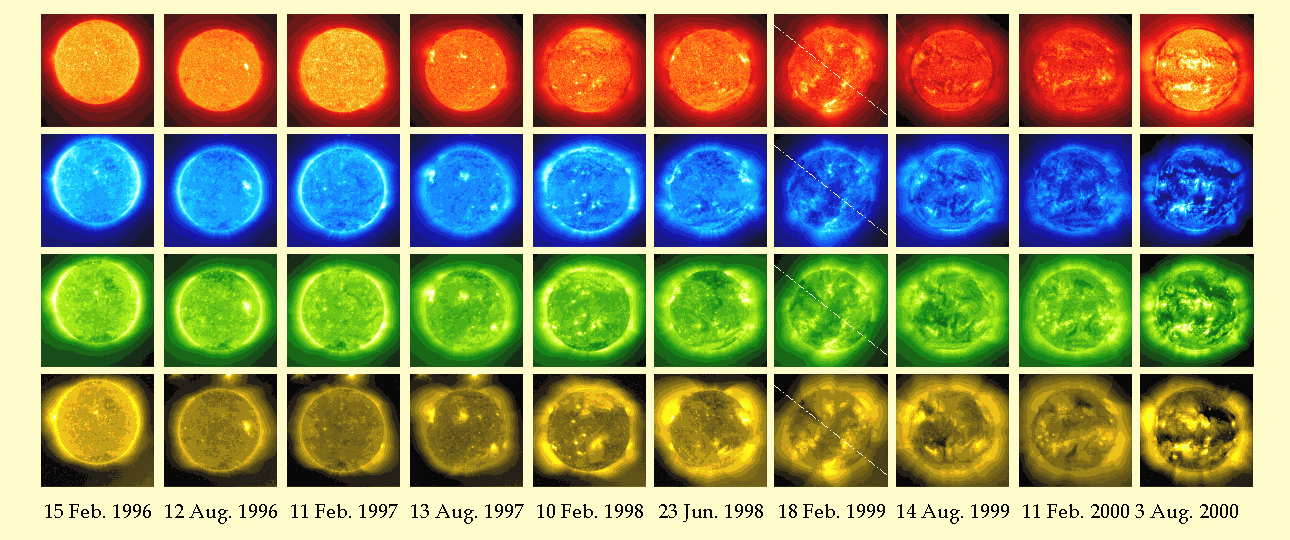
| Figure 11: EIT full-disc views of the EUV Sun from Feb. 1996 to Aug. 2000, at about 6-month intervals: top line is at 30.4 nm (He II, ~ 80 000 K), the second one is at 17.1 nm (Fe IX / X, ~ 1.3 10^6 K), the third one is at 19.5 nm (Fe XII, ~ 1.6 10^6 K) and the bottom line is at 28.4 nm (Fe XV, ~ 2 10^6 K). Images around Feb. 1999 are tilted due to the uncorrected roll attitude of SOHO after its recovery. During those first 4 years of cycle 23, the dramatic evolution of the coronal structure with the rising solar activity is conspicuous. |
The Belgian EIT archive
In its "synoptic" and "CME watch" observing modes, EIT has offered a global view of the corona since the start of the SOHO mission, monitoring its evolution over the whole rising phase of the current activity cycle. Such a data series is unprecedented. The EIT archive now contains more than 180000 images (Table 3) and EIT observations may well continue over a full solar cycle. The ROB team has accumulated and still maintains a full copy of this EIT archive in Uccle, on a magneto-optical jukebox. This is one of the few EIT archives allowing on-line random access to the data, which allowed our team to select, pre-process and distribute data to collaborating scientists in Europe. However, the availability of such a resource also opens unique opportunities for Belgian solar physicists to study the long-term evolution of the solar atmosphere on a global scale. Indeed, the TR and corona experienced deep changes during the rise of solar activity towards its maximum in 2000, as can be seen from the mosaic of Fig. 11. This prompted the introduction of a global EIT study project, with implications on our knowledge of the Sun-Earth relations, i.e. what is now called the space weather.
| Table 3: Statistics of the full field EIT data set (Synoptic + CME watch) |
|||||||||||||||
|
Data from BeER presentation of Joe Gurman (May 2000).
Global long-term EIT study
In order to be able to analyze systematically the huge EIT archive, the information must first be condensed automatically by pre-processing it using sophisticated algorithms. Therefore, the ROB scientists built up a strategy, in successive steps of increasing complexity, which extracts and synthesizes parameters of interest for the scientific interpretation. Our purpose is to identify and extract well-known solar objects (active regions, coronal holes, bright points, filaments, plumes, TR network, and maybe other new features) and dynamical events (flares, shock waves, coronal mass ejections, filament eruptions, jets). We will then track their properties and their mutual relationships at all space & time scales (locations, size, topology, lifetime, EUV brightness) over the rise of magnetic activity towards the current maximum.
In order to achieve these ambitious goals, collaborations were established with several international groups specializing in advanced image processing techniques, like image segmentation methods (I3D, Lille), pattern recognition (CEREMADE, Paris-Dauphine) or wavelet transforms (Université Catholique de Louvain). Existing methods are clearly pushed to their limits, given the complex topology and the optically thin "veils" forming the solar atmosphere. This confrontation thus opens opportunities for new experimentations and mathematical developments. Some early results, like the ridge detection by 2-dimensional wavelet transform (Fig. 12) look promising.
|
||||
|
Figure 12: Ridge detection by a continuous 2-D wavelet transform,
applied to the same region in all four EIT bandpasses. (L. Jacques, J.-P. Antoine, J.-F. Hochedez, E. Verwichte, BeER presentation by Laurent Jacques) |
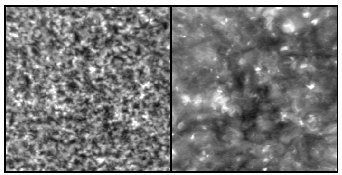
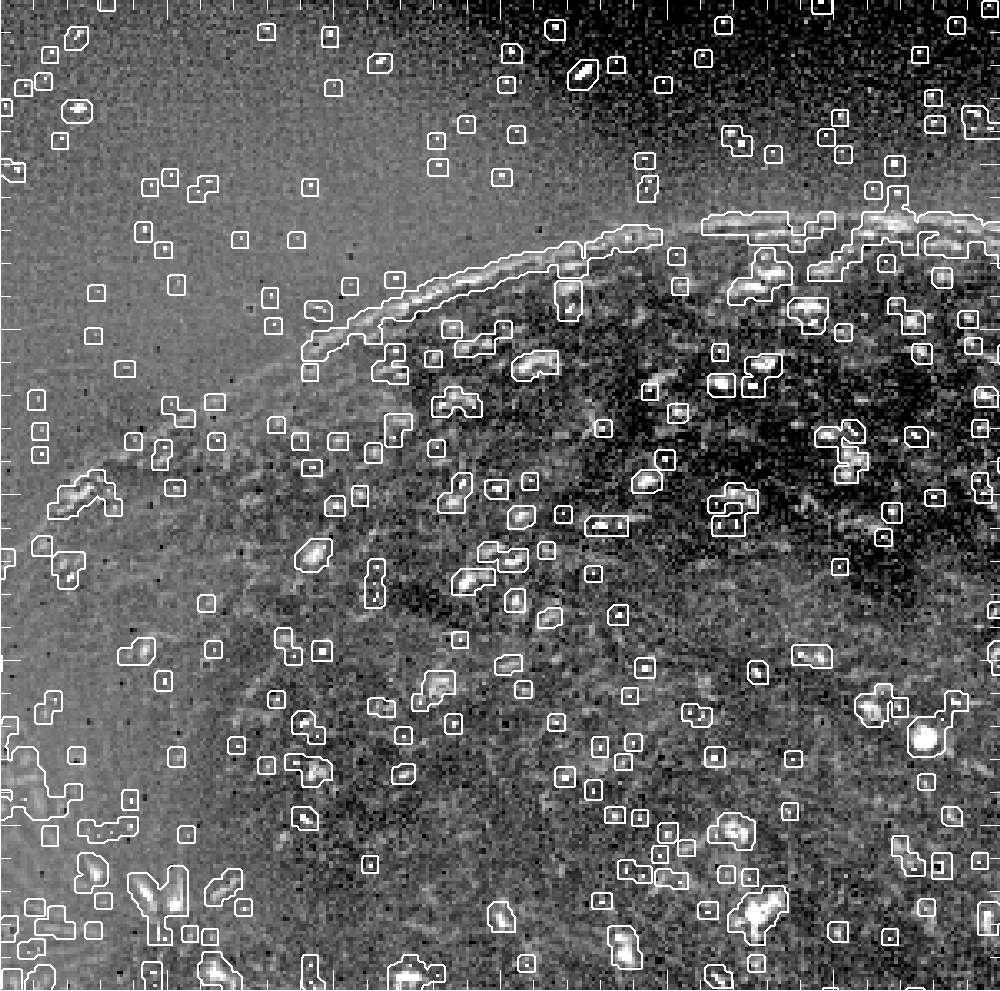
Currently, more fundamental steps of the analysis have been carried out: classification and selection of appropriate data sets and the analysis of the photometric properties of the images. These steps form the base for subsequent detection schemes and absolute determination of fluxes. In order to achieve this, several instrumental effects and artifacts must first be compensated. For instance, the detectability of the smallest solar features depends heavily on the proper separation of genuine solar point-like structures from cosmic ray hits on the CCD image sensor. For that purpose, a novel low-pass filtering method, called MPF (Minimum Plane Fit), has been developed. After removing cosmic rays (Fig. 13, middle panel), we found that the number of solar bright points, present mainly over the "quiet Sun" areas, steadily decreases by a factor of 3-4 while the solar activity increases. This initial result comes as a first confirmation of the inverse relationship with the solar cycle found recently using YOHKOH/SXT images [10]. Now, a physical explanation of this unexpected evolution remains to be found. The "cleaned" images can now be used for subsequent photometric surveys where the images are divided into darker and brighter regions. A physical criterion that relies on the photon statistics is then applied to label the areas. The whole process is illustrated in Fig. 13.
The scientific products of this EIT global study will have a wider impact, beyond the domain of coronal science. The coronal magnetic structures identified in this study will be used as tracers of the solar differential rotation, bringing new insights concerning the source of solar activity and, generally speaking, the solar variability: the dynamo mechanism at work deep under the solar surface. The EIT data will also later be injected into new Space Weather models designed by the Center for Plasma Astrophysics (Katholieke Universiteit Leuven), where the detailed properties of the low corona and TR will serve as input to heliospheric models. For that purpose, a project called "Solar Drivers of Space Weather" has been submitted to ESA. This project involves an international consortium of 9 institutes, including the ROB, which will supply observational data from SOHO instruments. This effort should eventually lead to a better understanding of the plasma propagation to the Earth and its interaction with the magnetosphere.
|
|||
| Figure 13: Example of a pre-processed image. Left: the raw image; Middle: detection of cosmic ray hits and bright points by the novel MPF technique; Right: intensity segmentation of the cleaned image (dark areas are coronal holes, regions of low density where the high-speed solar wind flows along open magnetic field lines). |
References
- [1] Delaboudinière, J.-P. et al. 1995, Solar Physics, 162, 291
- [2] Moses, J.D., et al. 1997, Solar Physics, 175, 571
- [3] Dere, K. et al. 2000,, Solar Physics., in press.
- [4] Kraichnan, R. H. 1965, Phys. Fluids., Vol. 8, N° 7, 1385
- [5] Dmitruk, P. & Gómez, D.O. 1997, Astroph. Journal Letters, 484, L83
- [6] Bruekner, G.E. & Bartoe, J.-D. F. 1983, Astroph. Journal, 272, 329
- [7] Shimizu et al., 1992., Publ. Astron. Soc. Japan, 44, L147
- [8] Nakariakov, V.M., Verwichte, E., Berghmans, D., Robbrecht, E.. 2000, Astron. & Astroph., in press.
- [9] DeForest, C.E. & Gurman, J.B. 1998, Astroph. Journal, 501, L217
- [10] Nakakubo, K. & Hara, H. 2000, Advances in Space Research, Vol. 25, Issue 9, 1905


