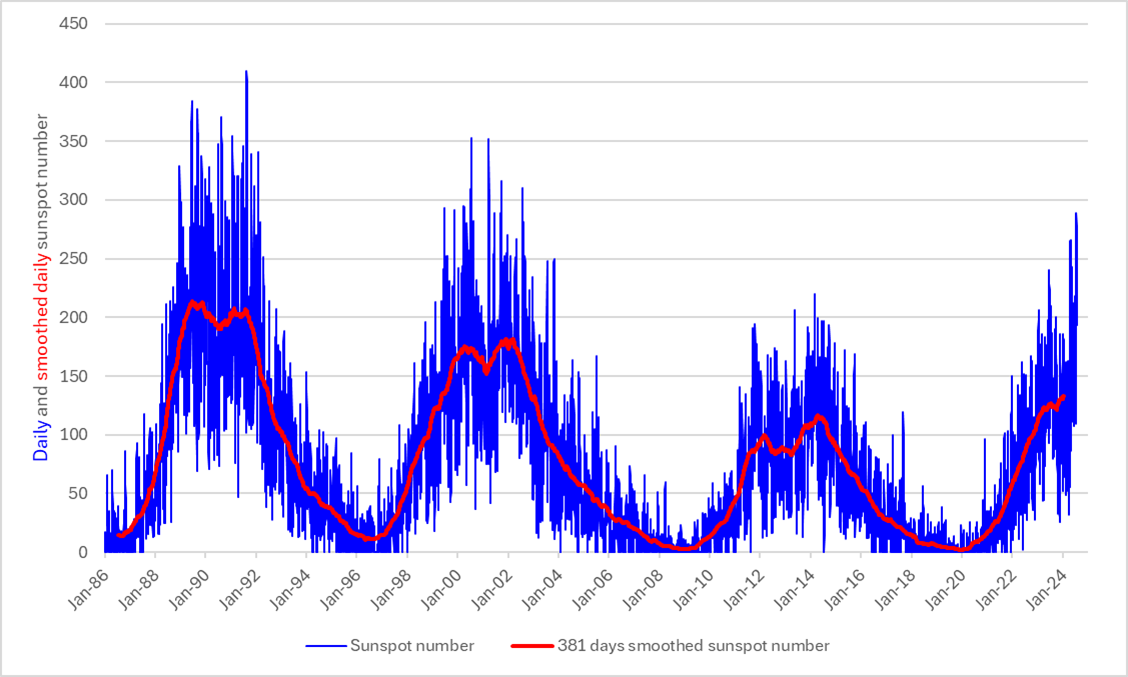
Last week's sunspot numbers were the highest so far during solar cycle 25 (SC25). The preliminary sunspot number reached values around 285 from 16 till 18 July. We have to go back to July 2002 to find higher values, when sunspot numbers varied between 290 and 310 (SILSO). The graph underneath shows the daily and smoothed daily sunspot number from 1986 (SC22) onwards. The 381 days smoothed value is simply the average value of 381 days of sunspot numbers, with 381 days corresponding to 14 solar rotations or about 12.5 months, showing the overall evolution of the solar cycle. Of note is the very low sunspot activity during the previous SC24, when sunspot numbers exceeded the 200-level on only a handful of days. The graph makes it also clear that sunspot numbers can reach much higher values, such as e.g. on 21 and 22 August 1991 when the sunspot number Sn was above 400. Since the start of the daily archiving by SILSO (1818 - present), the highest sunspot numbers recorded were in August 1870 (528 on the 26th) and in December 1957 (503 on 24-25th). In more than 200 years of near-continuous observations, only 5 days had a sunspot number in excess of 500. So far, the highest daily sunspot number during the 21st century was on 27 March 2001 (352).
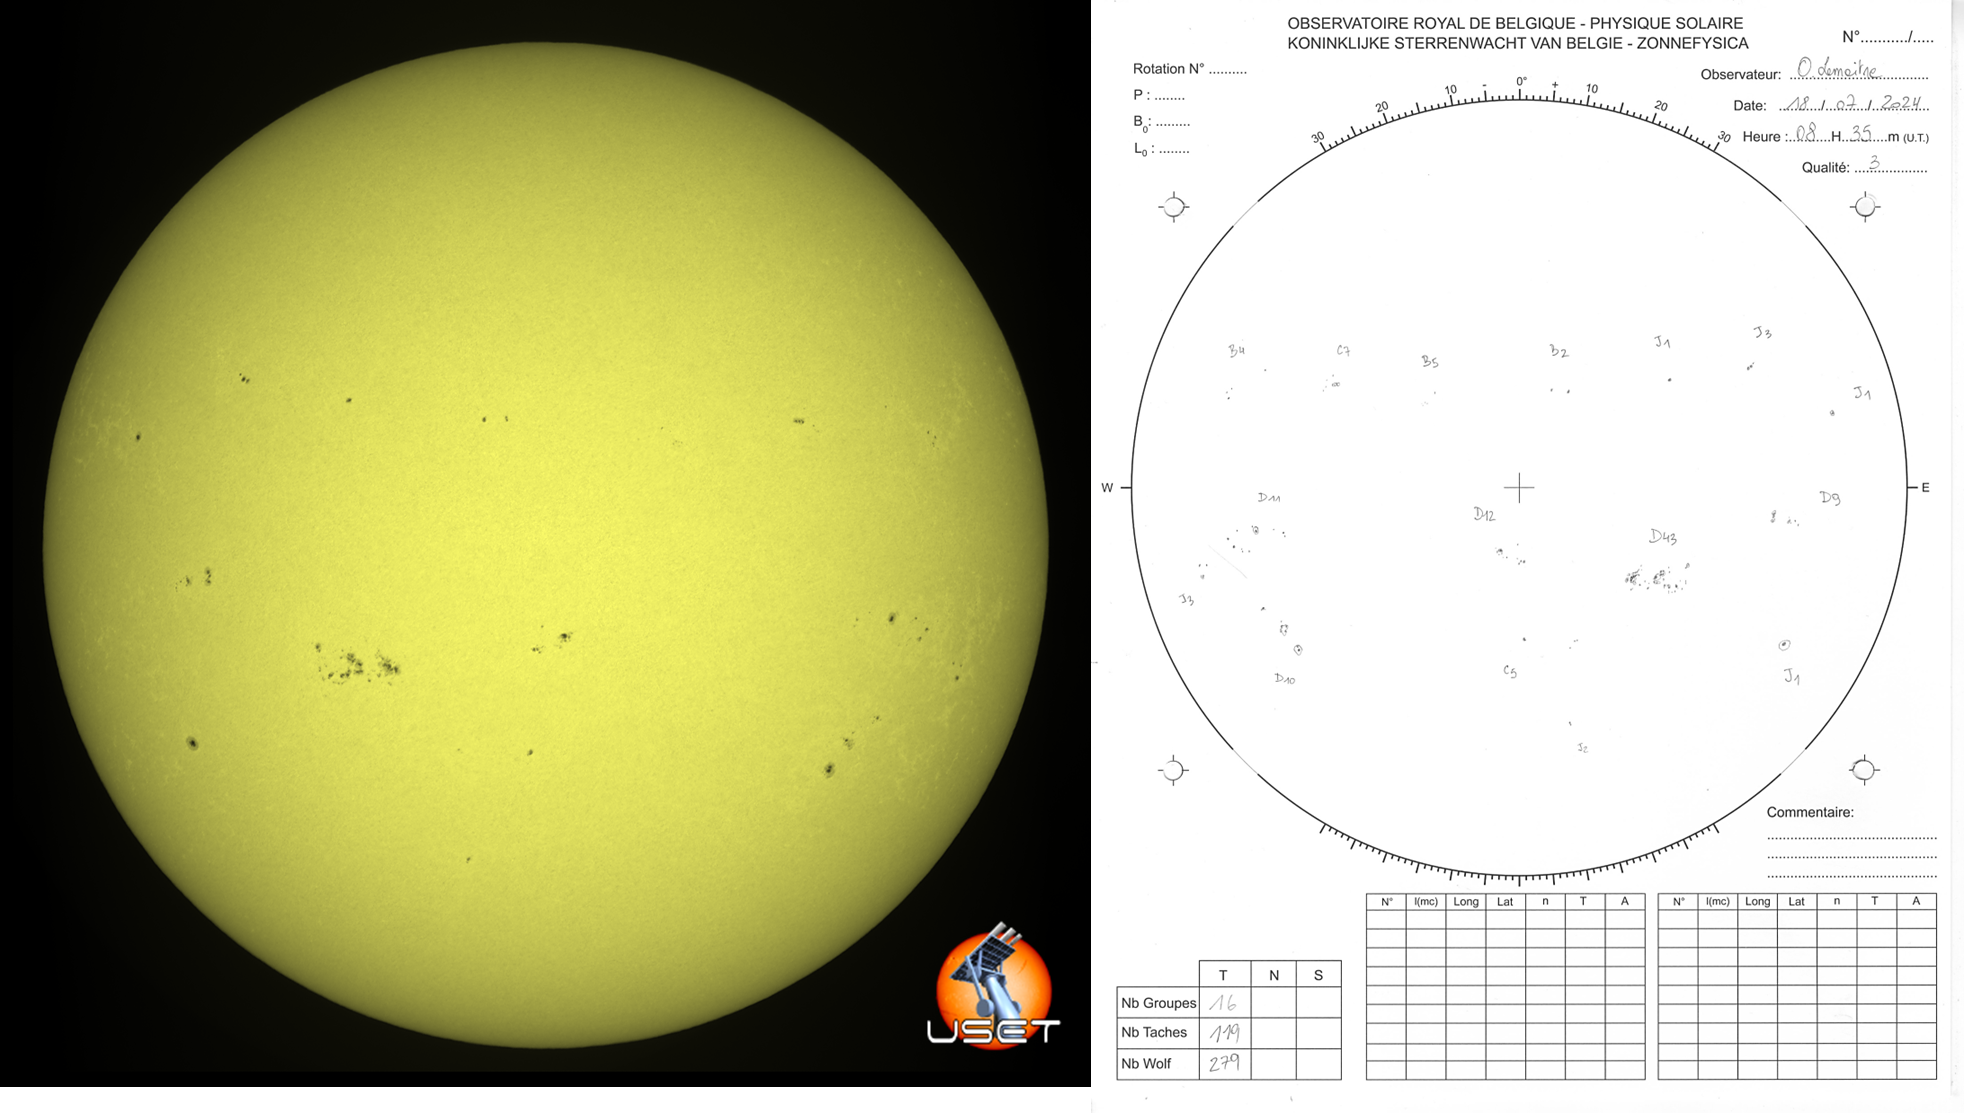
The mostly sunny weather in Belgium during July allowed the solar observers of the SIDC to monitor the Sun almost every day with their solar telescopes (USET , Uccle Solar Equatorial Table). Underneath are an image and a drawing (side reversed) made by the SIDC observers on 18 July, when the preliminary Sn was at its highest (289). The image and the drawing reveal 16 sunspot groups, and the observer penciled 119 dark spots, good for a total sunspot number of 279 (= 10x16 + 119). It's a coincidence that the USET sunspot number and the preliminary Sn correspond so well for this day, as Sn is of course an average of several observers (31 for that day) who use different telescopes and different observing methods rescaled to the reference observer (Sn version 2.0).
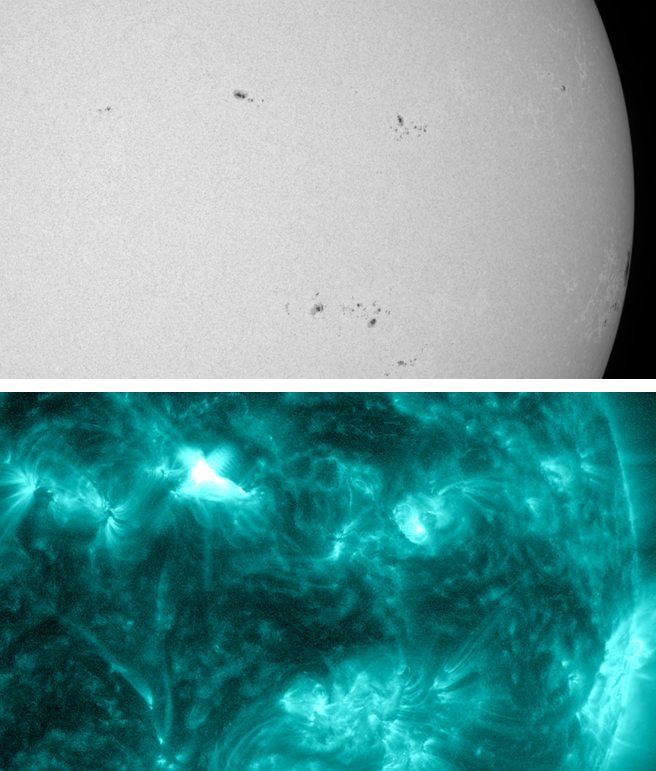
Nearly 2 dozen of M-class flares were produced during last week, mostly by the larger and more complex sunspot regions such as NOAA 3738 (4 M- and 1 X-class flare) and 3751 (5). Despite the relatively small size of some of the sunspot groups, they were also contributing to the M-class flaring activity. The image (SDO) underneath shows small active region NOAA 3744 in white light at the time (22:06UTC on 16 July) that an M1.9 flare took place in this region (extreme ultraviolet). NOAA 3744 and NOAA 3753 -another small region- produced 5 M-class flares each.